
What Is Your Home Worth in Runaway Bay, Gold Coast?
Runaway Bay Property Market
Market statistics for Runaway Bay SA2
Median House Price
$1,900,000
94 house sales | 12 months ending 30 June 2026
Suburbs associated with this SA2 region: Runaway Bay
Source: Queensland Government Statistician's Office, Queensland Housing Profiles. Figures are preliminary and relate to the Runaway Bay SA2 statistical area, not an individual property valuation.
Wondering what your home in Runaway Bay, Gold Coast is worth? Discover how recent local property sales, buyer demand and your home’s unique features could influence its current market value.
Find out what your home is really worth with a free, personalised property appraisal. No obligation to sell.
Understanding Your Property’s Value
Request a free property appraisal in Runaway Bay. Discover what your property could be worth in the current local real estate market.
How We Estimate Property Values in Runaway Bay
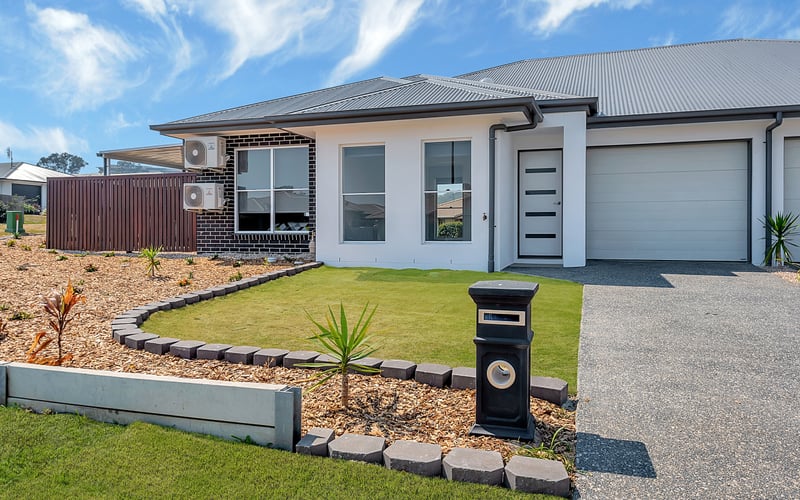
Understanding the potential value of your property in Runaway Bay starts with knowing the local real estate market.
A property appraisal in Runaway Bay considers recent comparable sales, land size, property condition, location and current buyer demand to help estimate a realistic selling price.
Whether you’re thinking about selling your Runaway Bay property soon or simply want to understand its current market position, requesting an appraisal is a useful first step.
What can influence property values in Runaway Bay?
– Recent sales of similar properties in Runaway Bay and surrounding areas
– Land size, floor plan and overall property condition
– Renovations, improvements and property features
– Local buyer demand and market conditions
– Location, nearby amenities and neighbourhood appeal
Complete the enquiry form to request a free, no-obligation property appraisal in Runaway Bay.
Request Your Free Appraisal
Complete the form below and we’ll be in touch.
Please read our
Privacy Policy.
Property Values and Real Estate in Runaway Bay, Gold Coast
Location
Other Local House Valuations
Runaway Bay – 2021 Census Property Profile
| Population | 9,308 |
|---|---|
| Total Homes | 4,443 |
| Houses | 1,797 |
| Townhouses & Duplexes | 1,049 |
| Units & Apartments | 1,121 |
| Homes Owned Outright | 1,708 |
| Homes With a Mortgage | 1,101 |
| Rented Homes | 964 |
According to the 2021 Census, Runaway Bay had 1,797 occupied houses, 1,049 townhouses and duplexes, and 1,121 units and apartments. Of these three types of homes, houses made up 45.3%, townhouses and duplexes 26.4%, and units and apartments 28.3%. Houses were the most common of these three types of homes.
Home ownership figures from the 2021 Census show that Runaway Bay had 1,708 homes owned outright, 1,101 homes with a mortgage and 964 rented homes. The shares of these three categories were 45.3%, 29.2% and 25.5% respectively. Owning a home outright was the most common of these three housing arrangements in Runaway Bay.
2021 Census — People, Income and Housing Costs
| Median age | 54 years |
|---|---|
| Median weekly personal income | $727 |
| Median weekly family income | $1,852 |
| Median weekly household income | $1,382 |
| Median weekly rent | $435 |
| Median monthly mortgage repayment | $2,000 |
| Average persons per bedroom | 0.7 |
| Average household size | 2.2 |
According to the 2021 Australian Census, Runaway Bay had a median age of 54 years and an average household size of 2.2 people. Median weekly household income was $1,382. The Census also recorded median weekly rent of $435 and median monthly mortgage repayments of $2,000.
Source: Australian Bureau of Statistics, 2021 Census. Dwelling-type counts refer to occupied private dwellings.